Canary Dashboard
Trust numbers, not headlines.
Your daily risk traffic light, market health, stock and crypto conditions screener and more.
Founding membership · first 100 members
Join as a founding member
US$35/mo
billed annually (US$420/yr)
US$70/mobilled monthly
Founding rate locked for life while you renew. After the first 100: US$99/mo or US$1,069/yr.
Claim your founding spotEducational market data only. Not financial advice.
Trader Cockpit
Everything you need in One Dashboard.
Market Composite Score
Thirteen market roll up into one green, amber or red light for US market health, updated after every US trading day.
Scanners & Setups
Ranked scanner lists across stocks, sector ETFs and crypto — canary readings and lists refresh after each US session.
Backtest our indicators
Members can fully backtest each emoji mark for historical results — see prices after past Fish, Smiley, MFI and Sweaty prints.
Email Alerts (Setups)
A weekly email with top bullish and bearish setups from the scanners, charted with their marks, plus a short market read. Education, not tips.
Proprietary indicators
Members get access to our proprietary TradingView indicators — the same marks we use on the dashboard — on their own charts.
Community & support
Private community, weekly commentary and Q&A, plus WhatsApp and email support.
Features
Take a closer look.
See what the dashboard looks like
Members cockpit — Traffic light, regime and today’s scanner lists on one screen.
Examples
Recent examples
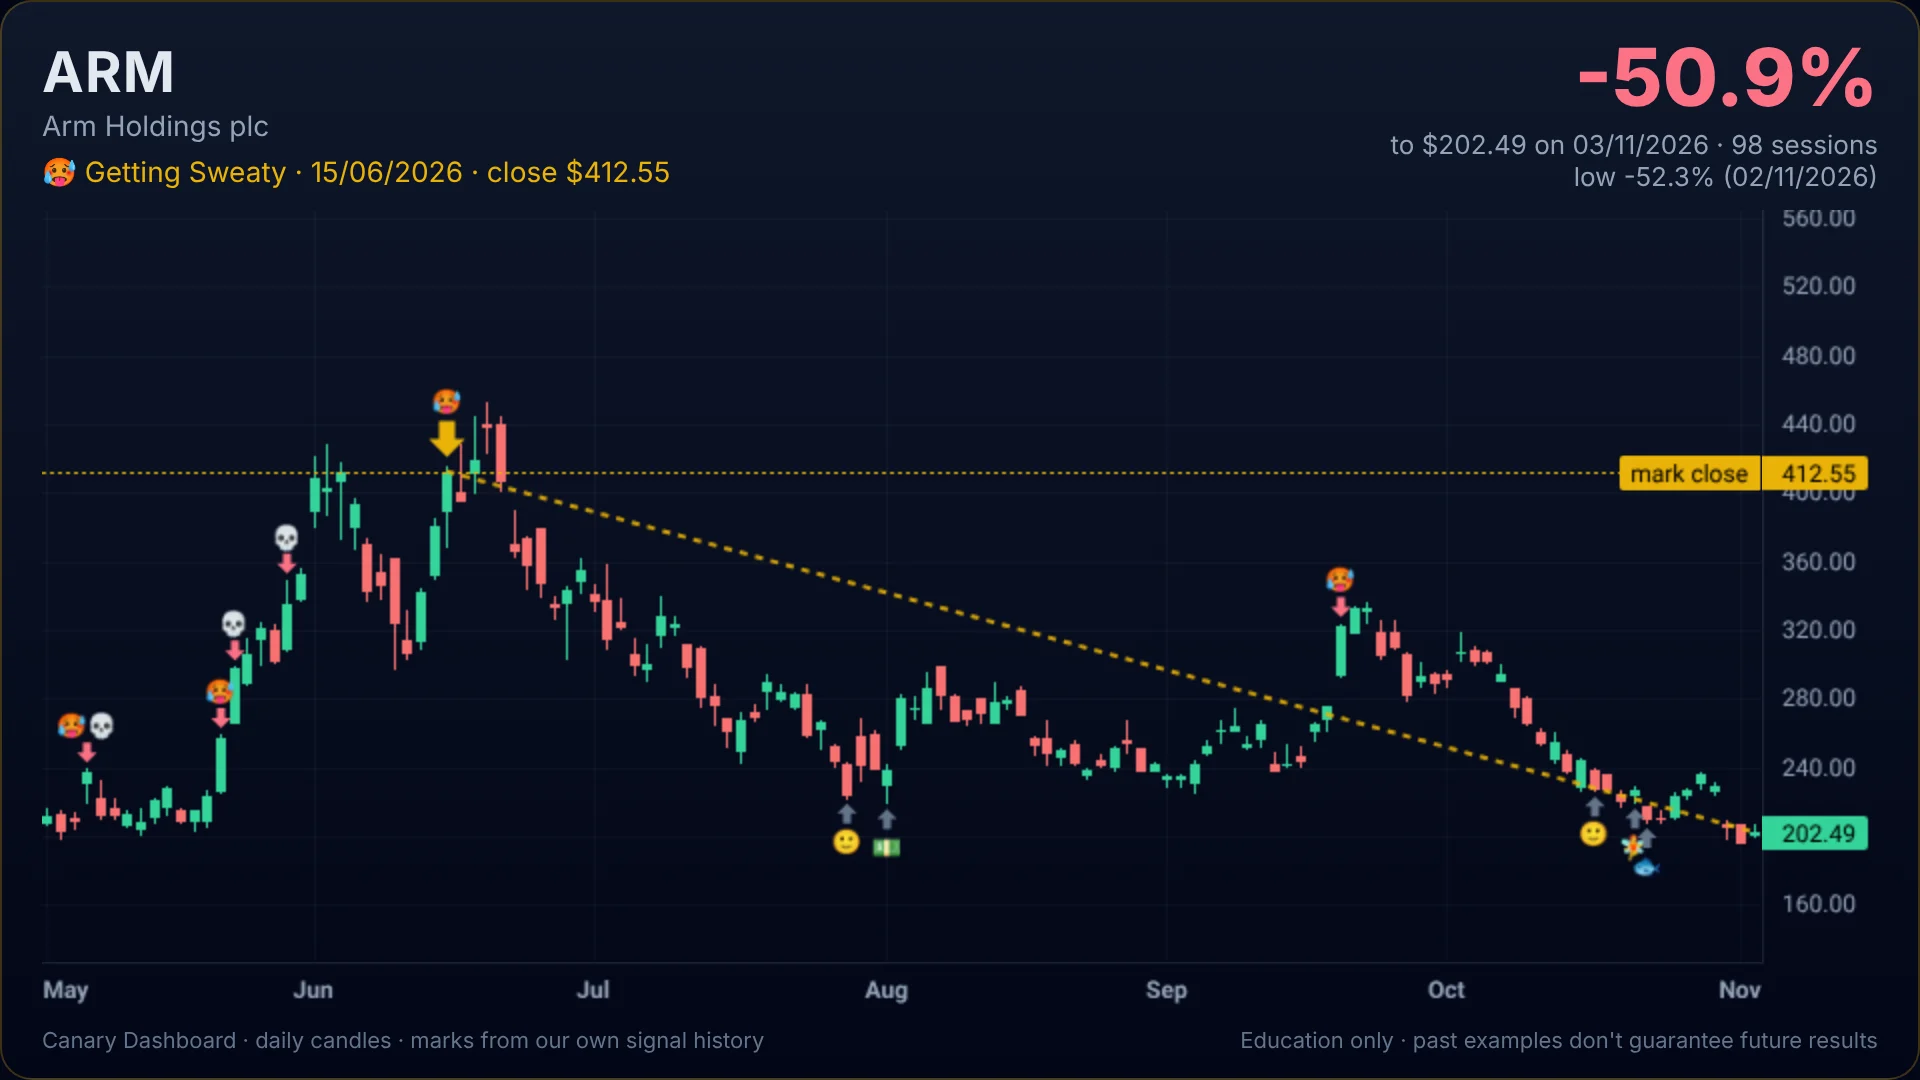
ARM · 🥵 Getting Sweaty
Marked Jun 15, 2026 at $412.55. Close $202.49 (Nov 3, 2026): -50.9% in 98 sessions.
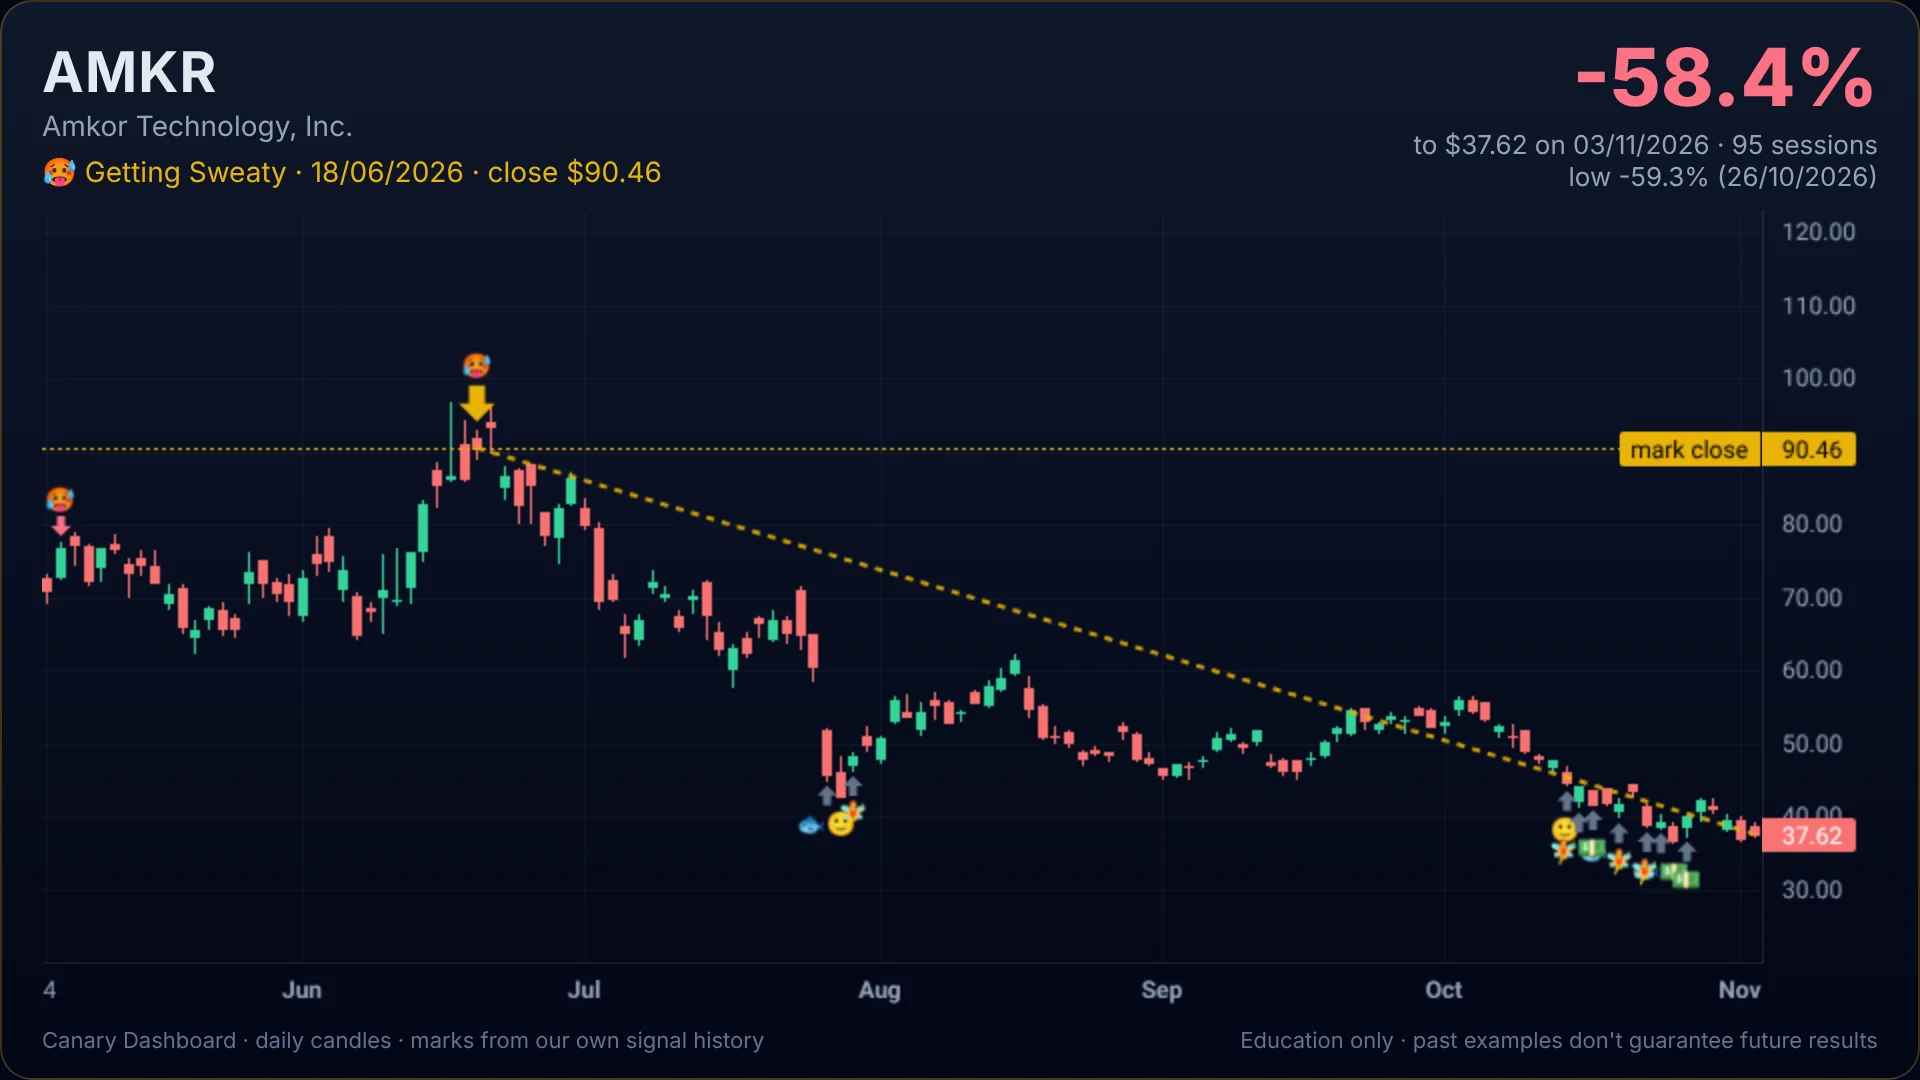
AMKR · 🥵 Getting Sweaty
Marked Jun 18, 2026 at $90.46. Close $37.62 (Nov 3, 2026): -58.4% in 95 sessions.
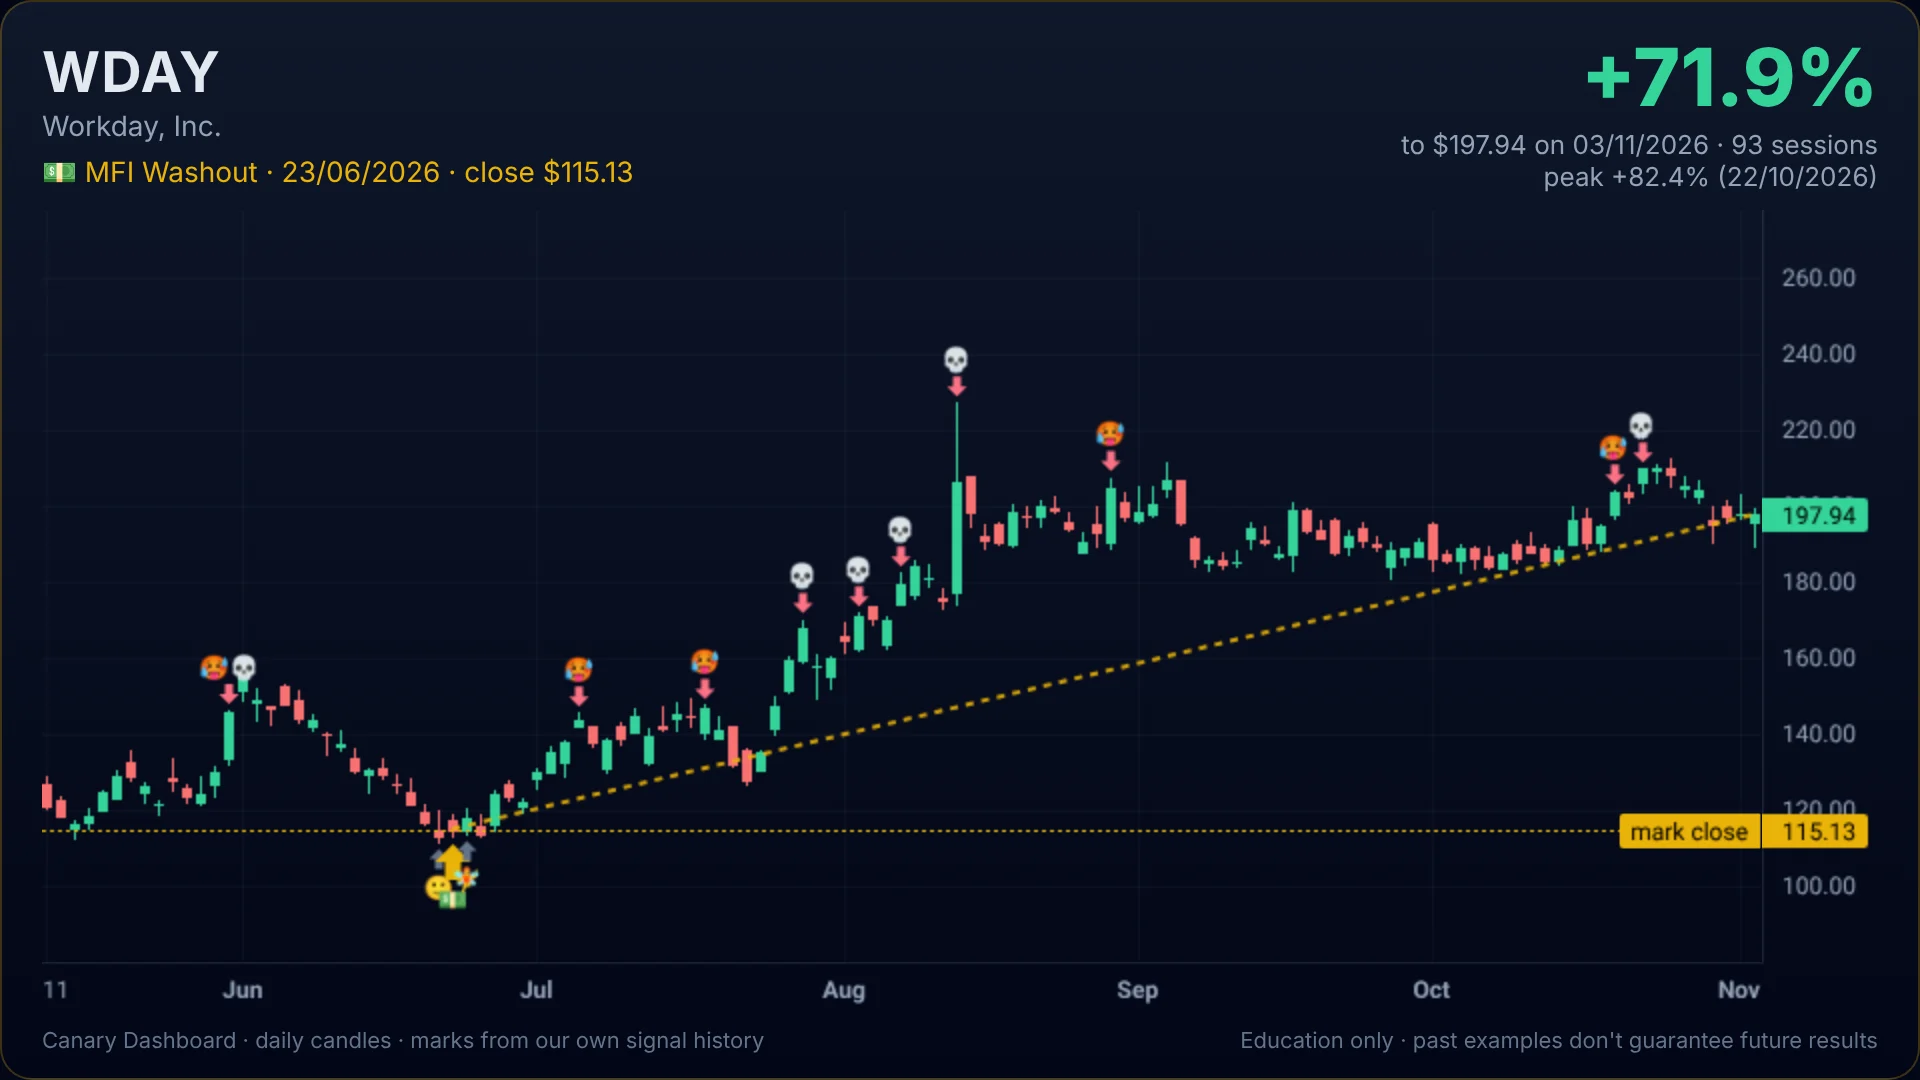
WDAY · 💵 MFI Washout
Marked Jun 23, 2026 at $115.13. Close $197.94 (Nov 3, 2026): +71.9% in 93 sessions.
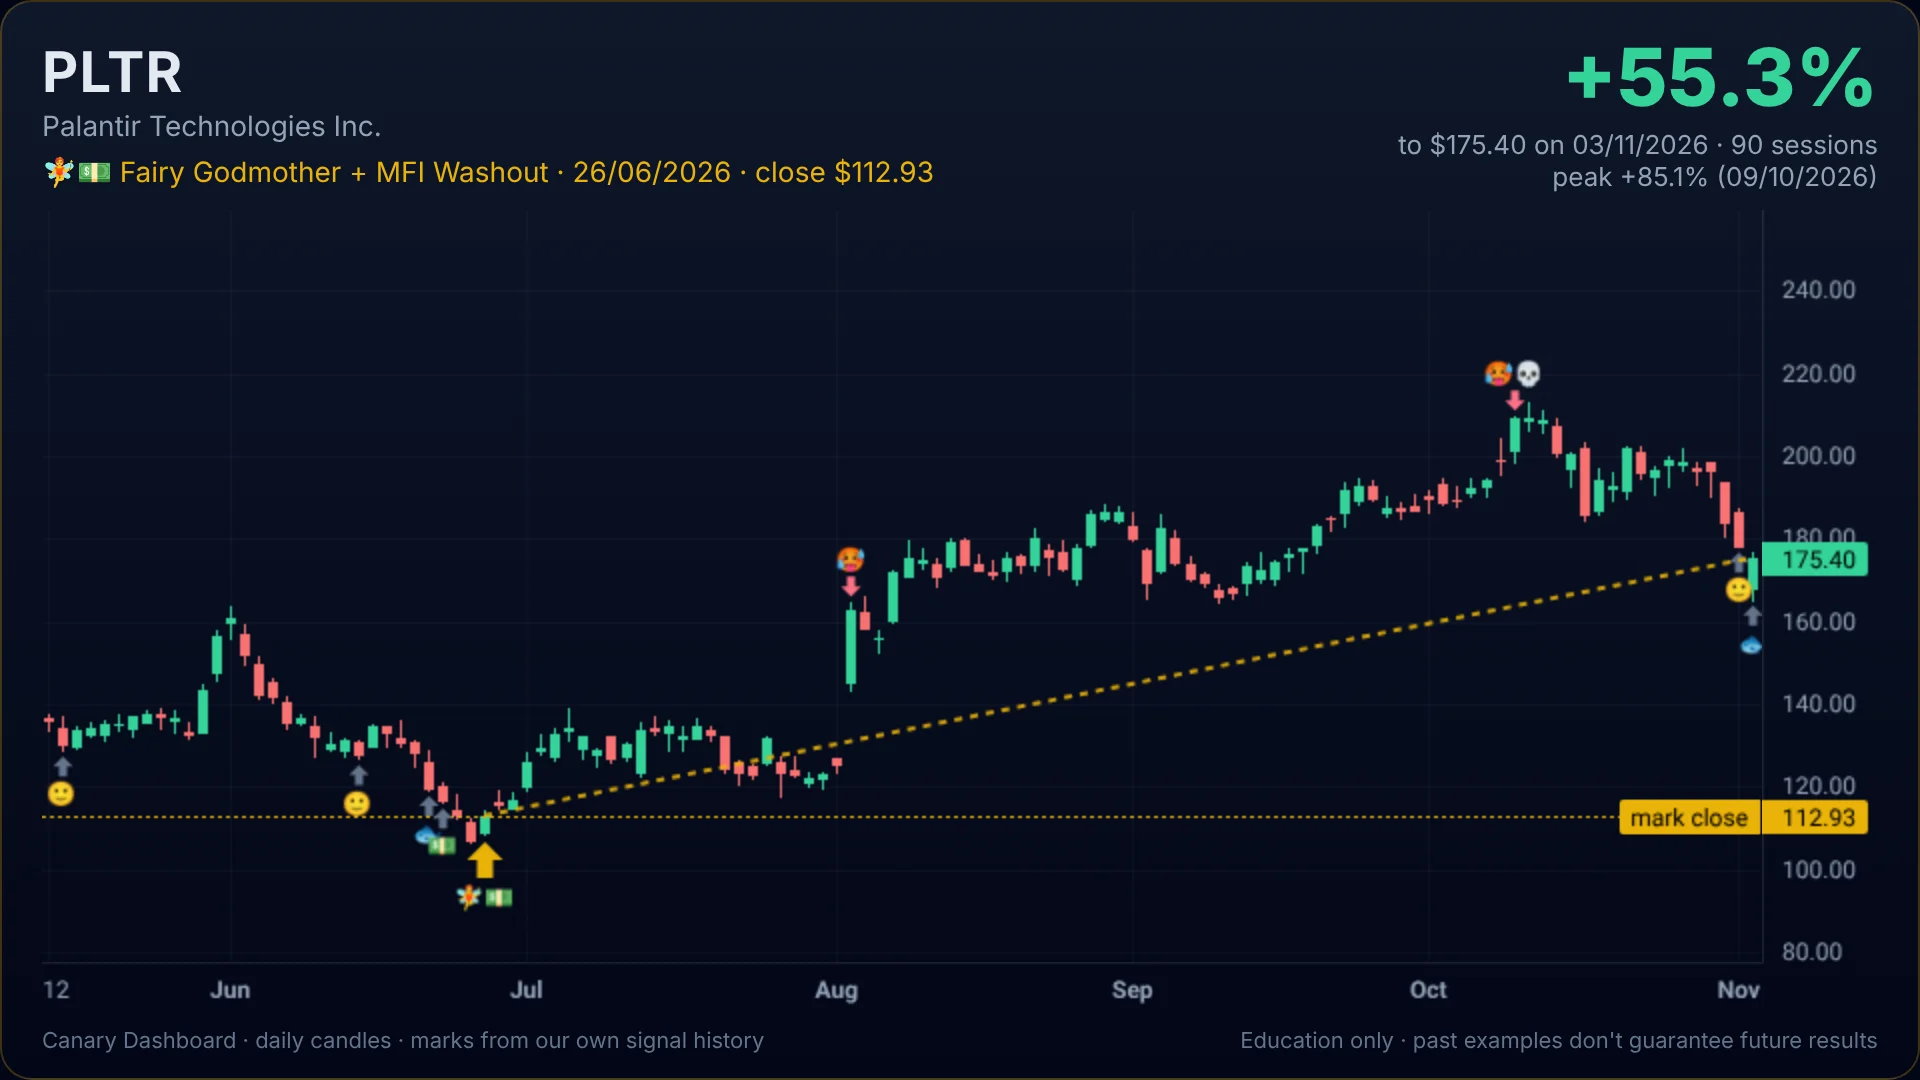
PLTR · 🧚 Fairy Godmother + 💵 MFI Washout
Marked Jun 26, 2026 at $112.93. Close $175.40 (Nov 3, 2026): +55.3% in 90 sessions.
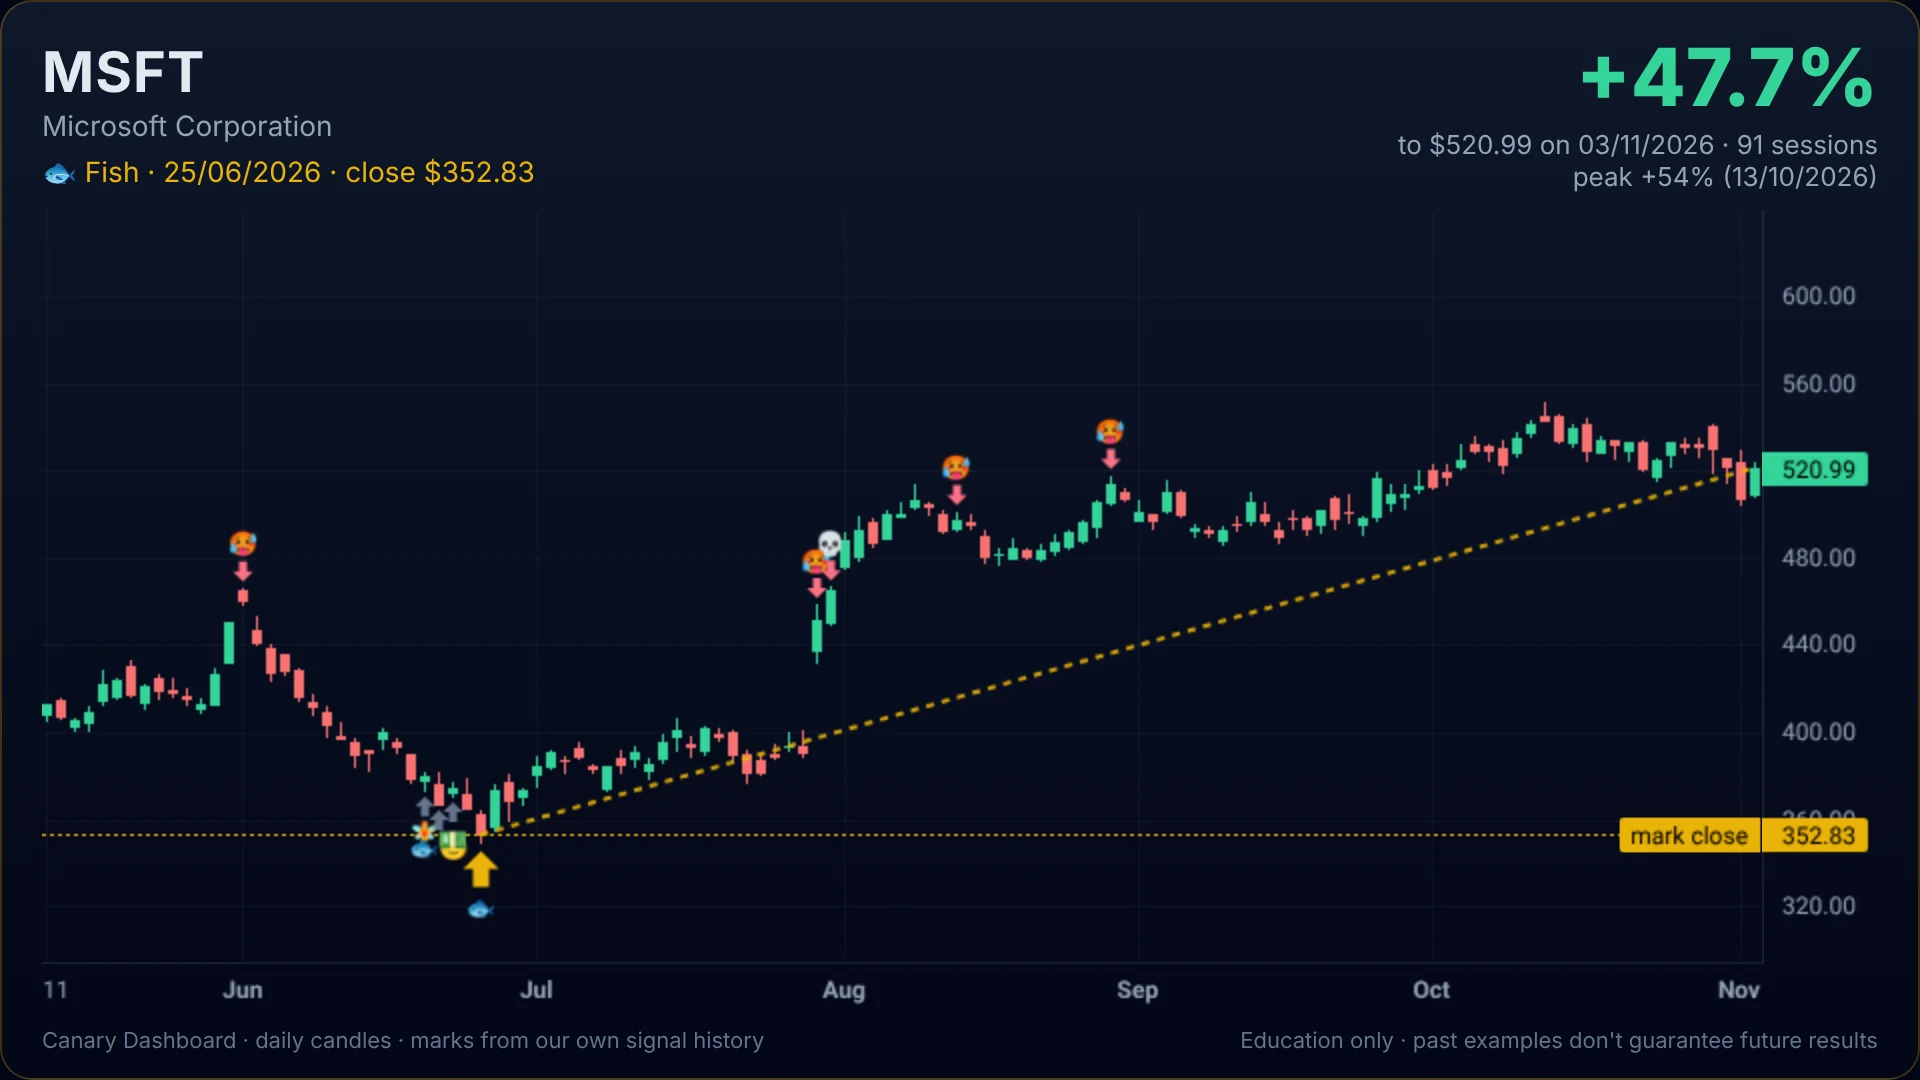
MSFT · 🐟 Fish
Marked Jun 25, 2026 at $352.83. Close $520.99 (Nov 3, 2026): +47.7% in 91 sessions.
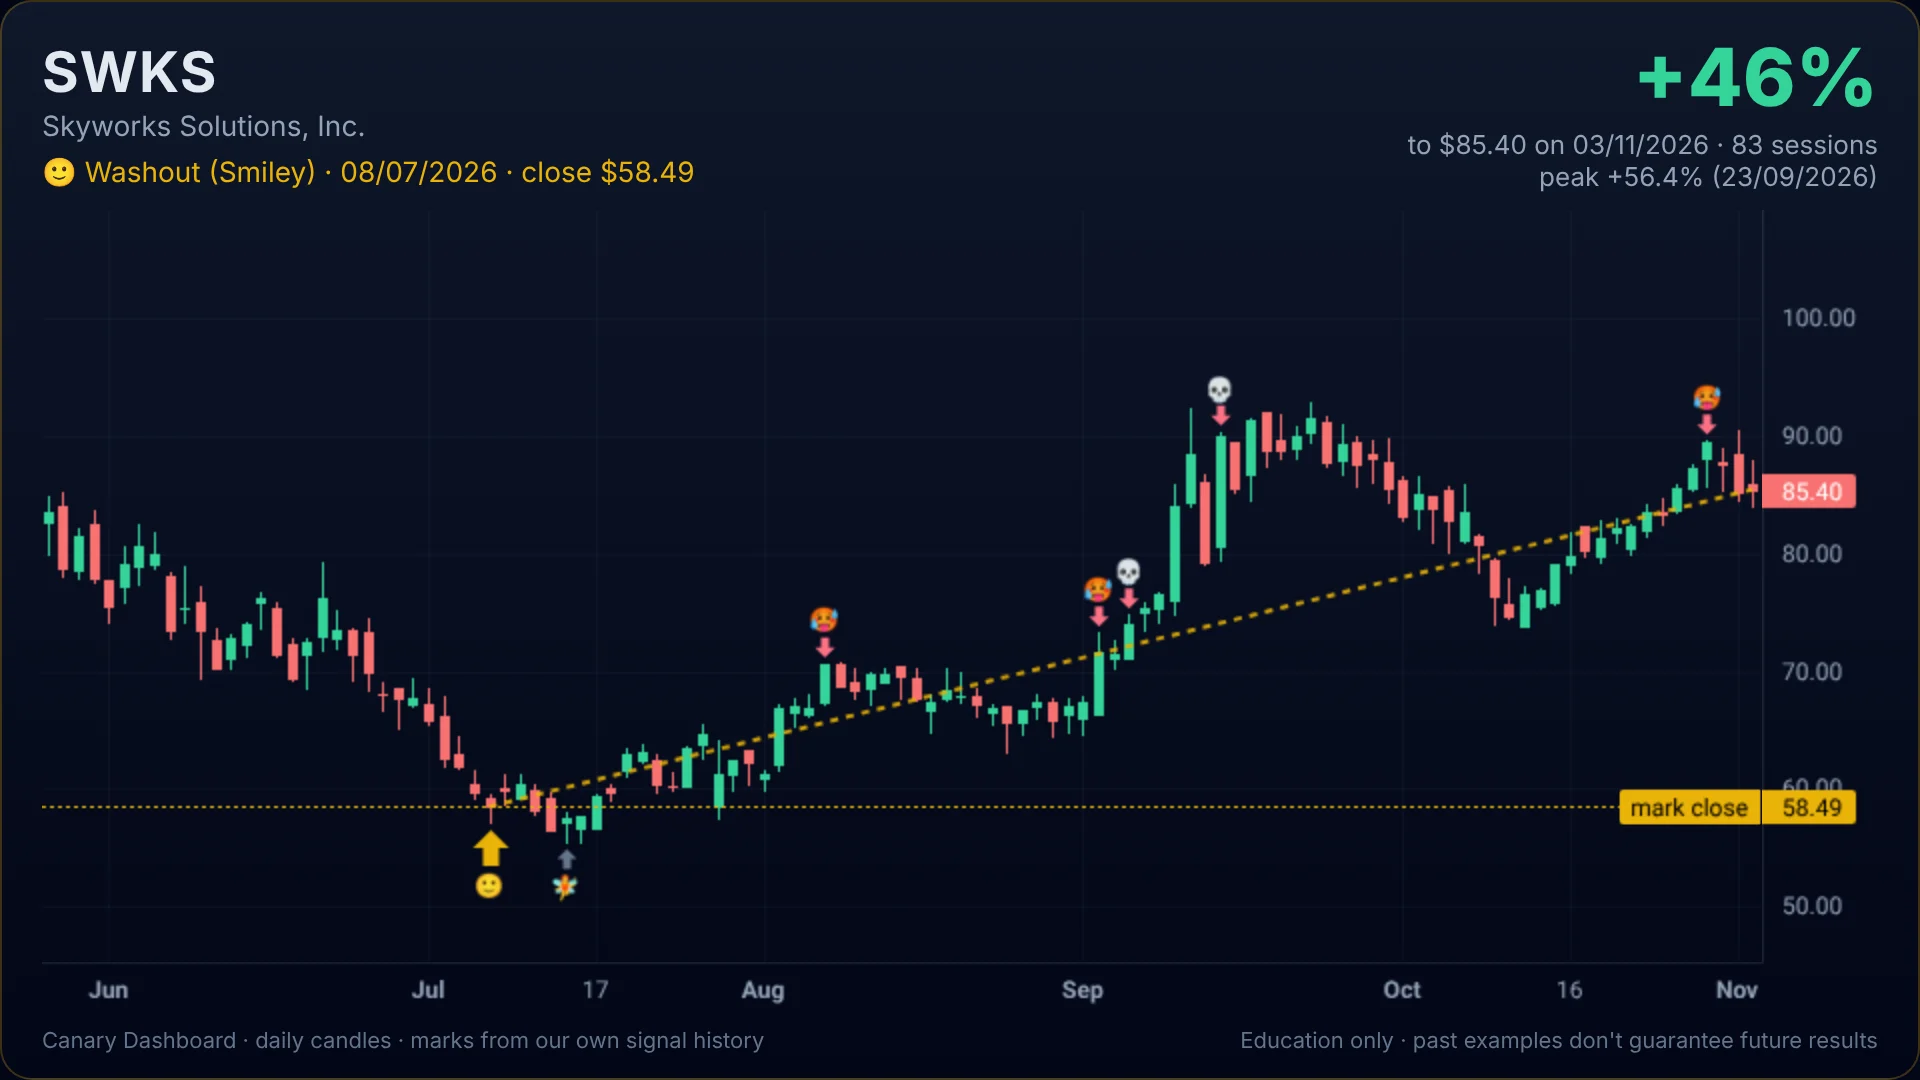
SWKS · 🙂 Smiley
Marked Jul 8, 2026 at $58.49. Close $85.40 (Nov 3, 2026): +46.0% in 83 sessions.
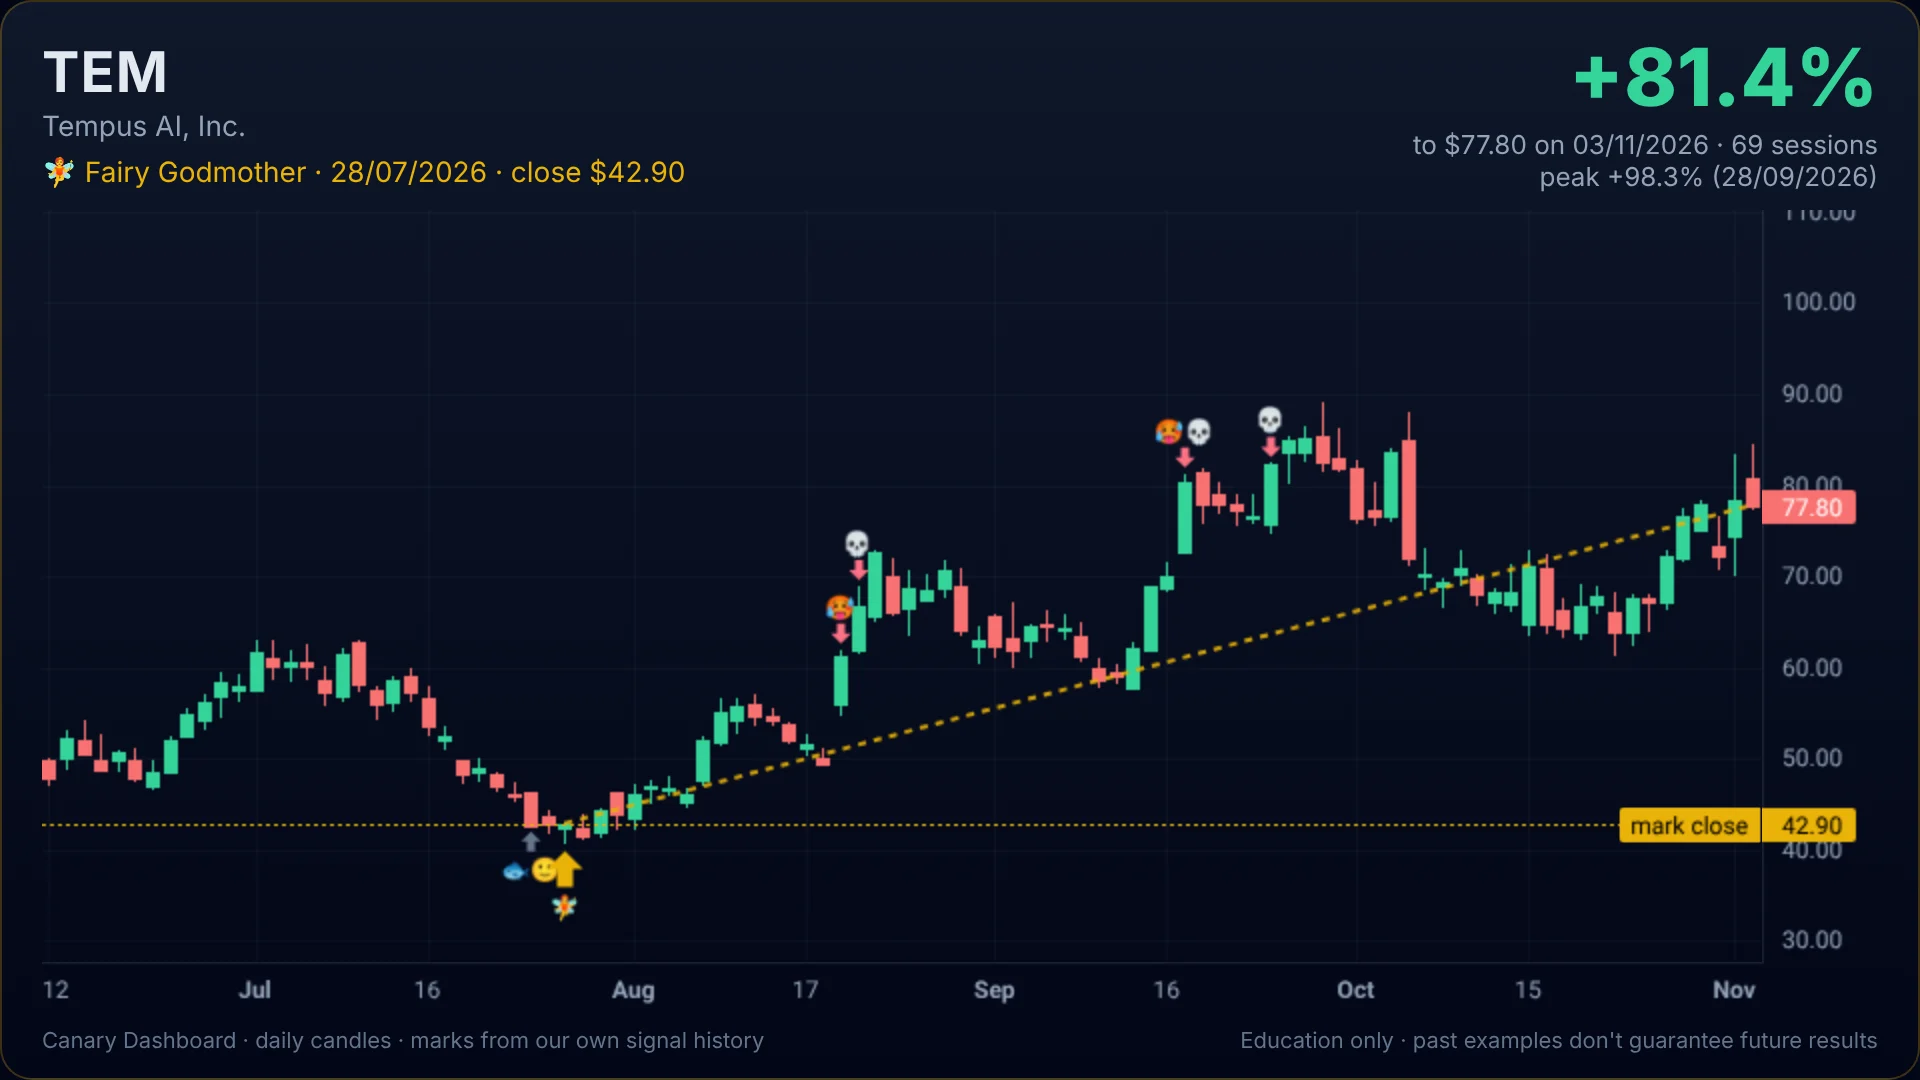
TEM · 🧚 Fairy Godmother
Marked Jul 28, 2026 at $42.90. Close $77.80 (Nov 3, 2026): +81.4% in 69 sessions.
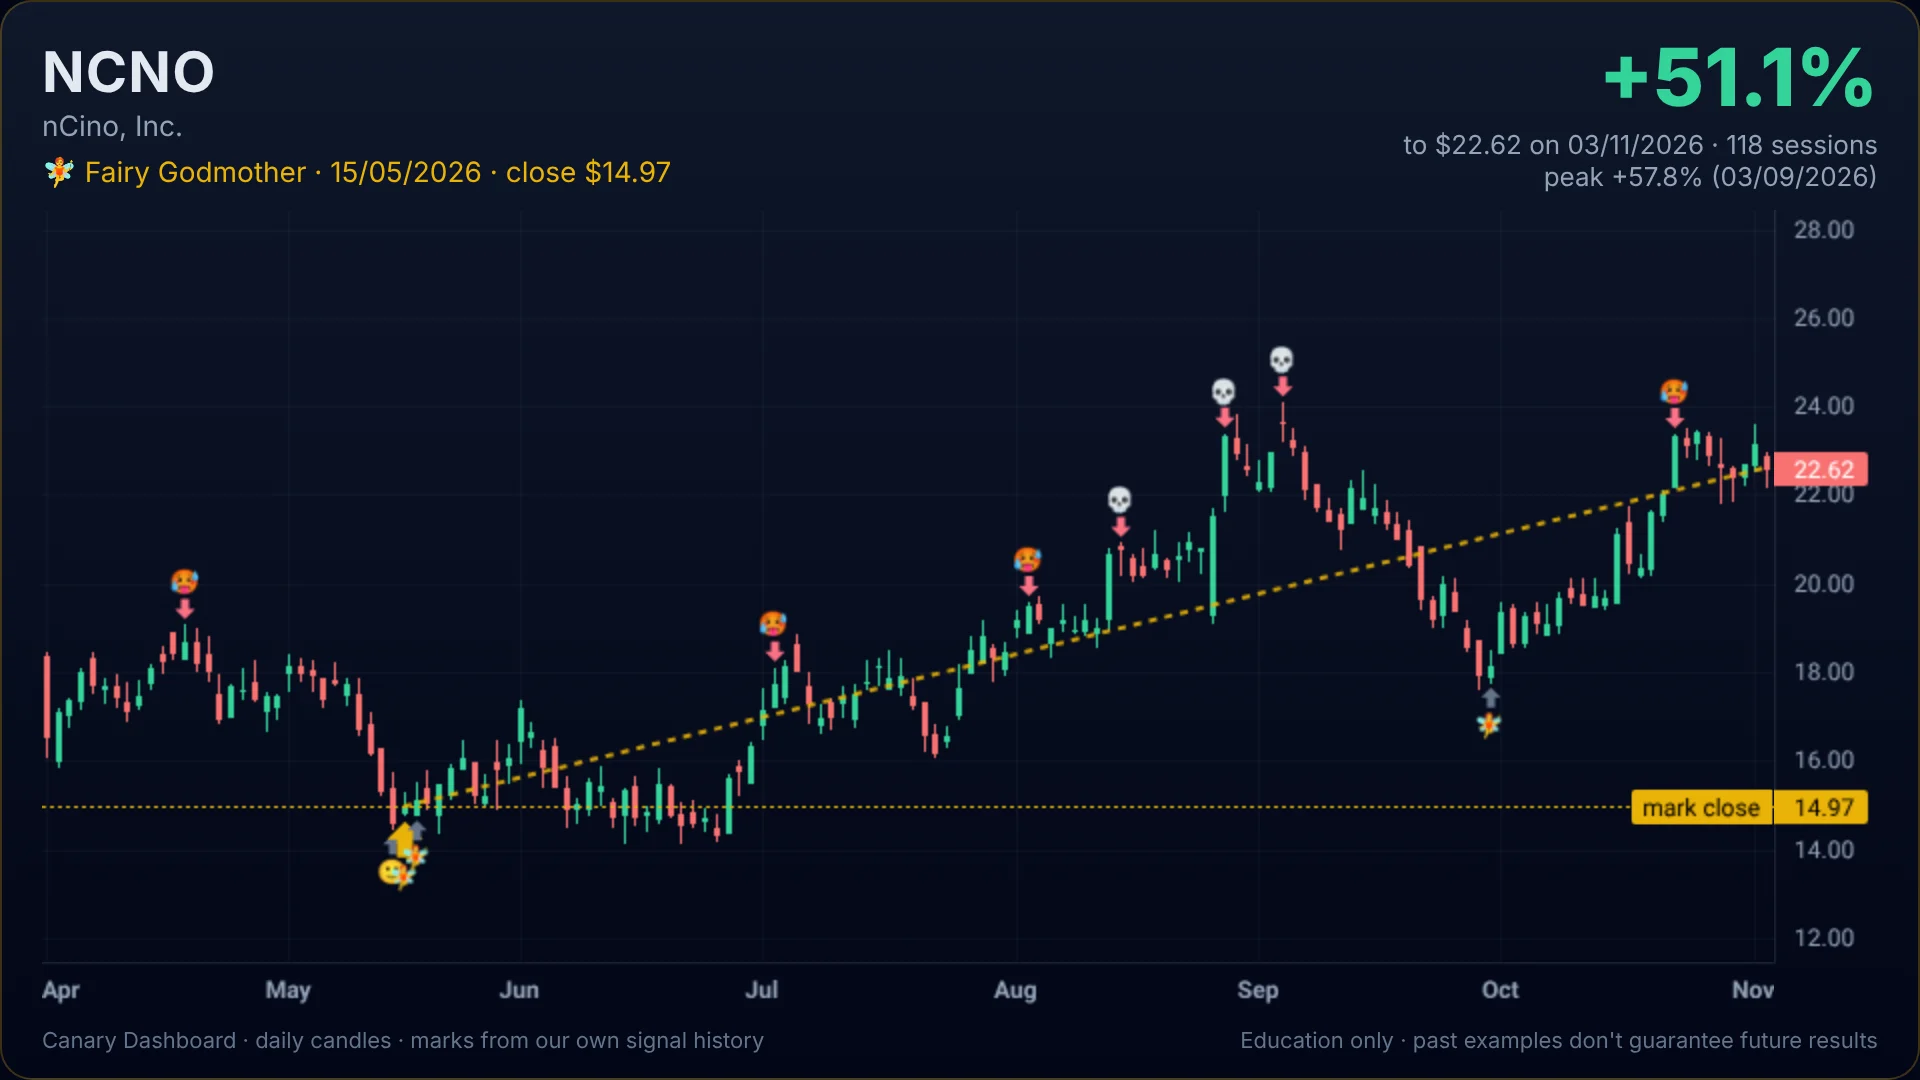
NCNO · 🧚 Fairy Godmother
Marked May 15, 2026 at $14.97. Close $22.62 (Nov 3, 2026): +51.1% in 118 sessions.
Education only. Past readings don't promise future results. Nothing here is a recommendation to buy or sell any security.
Subscribe
Get the weekly setups in your inbox
What would you like to hear about?
Unsubscribe any time. Not financial advice.
Chart marks
Know what every mark means.
Scanner marks are process labels for study, not buy or sell tips.
Smiley
Time to look closely, in overcooked zone.
Time to Fish
Relative momentum washed out starting to recover.
MFI Washout
Money-flow reading at a washed-out extreme and recovering.
Getting Sweaty
Price stretched versus its own history.
Rolling over
A stretched name that has momentum rolling over.
Fairy Godmother
Canary's proprietary bottoming indicator
Join us and be among our Founding Members
US$35/month, billed annually (US$420) · Not subject to future price increases
(Less than TradingView Premium's US$59.95/month)
- Full dashboard access
- Indicators free (RelRSI, MFI Washout, Vanna & Charm)
- Access to future indicators
- Weekly broader market update video
- Email and WhatsApp support
Questions
What is Canary Dashboard?
A members' dashboard that sums up US market health in one place: a traffic light and composite score built from 13 market canaries, plus scanner lists for education and study. Not investment advice — and it won’t tell you what to buy or sell.
How often is it updated?
Daily. Canary readings and scanner lists refresh after each US trading day, and members also get a weekly review.
Who is it for?
People who want a repeatable, number-based check on market conditions instead of reacting to headlines. Education only.
Can I cancel?
Yes. Turn off auto-renew at any time and keep your access until the end of the paid year.
Education only. Not investment advice. Nothing here is a recommendation to buy or sell any security.